Sampling Bias
And how to avoid it
Thanks to the rainy spring and early summer, a few volunteers have contacted me to ask if they should sample right after a rain when the water is still muddy. There are probably many more people wondering the same thing but not reaching out, making this a good opportunity to discuss the function of the LMVP Sampling Calendar.
Ideally, all LMVP volunteers sample 8 times per season, once every three weeks from late-April through mid-September. This sampling schedule helps us to meet our goals of describing current water quality and monitoring for long-term trends in water quality. We know that water quality will vary throughout the sampling season and that the levels of nutrients, chlorophyll and suspended sediment in our lakes will differ between dry years and wet years.
By consistently sampling at regular intervals we are reducing the influence of humans on the results, or more technically, we are reducing sampling bias. Sampling bias refers to sampling when certain conditions are more likely to occur than others. For example, we know that air temperature changes during the course of a day. If you wanted to report the average temperature for a single day, you would need to monitor the temperature across the 24-hour period. If you only monitored while you were awake and failed to include nighttime readings, you would skew the data. The temperature readings would also need to be evenly spaced throughout the 24-hour period. If you collected measurements every half hour during the day and every two hours at night (because you wanted to sleep!) daytime temperatures would be overrepresented in the data. The reported average would be higher than the actual average.
The same notion applies to considering when a lake is sampled. Imagine the data we’d end up with if we only sampled on “nice” days. “Nice” days are probably not too hot, certainly not rainy, and the water is probably pleasant to be around. In other words, “nice” probably means that the chlorophyll and suspended sediment values would be lower than usual and there would be better than average water clarity (Secchi). Similarly, if we sampled only after a rain, the data would skew in the other direction. By sampling according to a schedule we reduce the sampling bias.
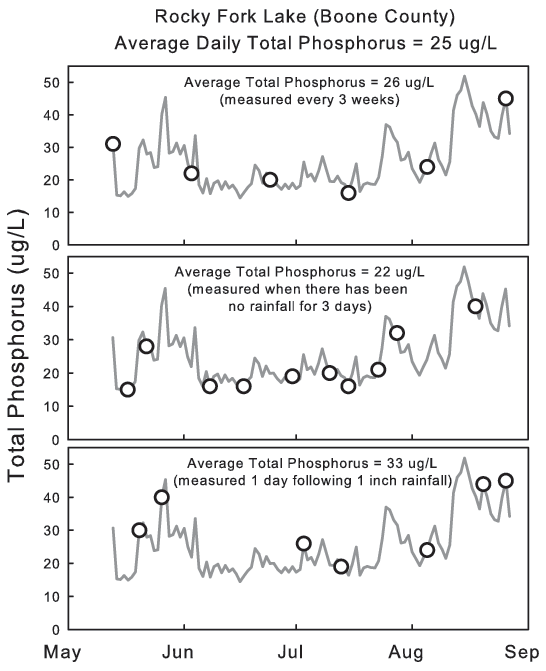
The graph below illustrates the effect of sampling bias. Rocky Fork Lake was sampled as part of a 2004 project where the lab measured water quality every day in 3 Missouri lakes. Total phosphorus averaged 25 ug/L across the 107 days of the project. Sampling every 3 weeks (top panel) results in an estimated average of 26 ug/L of total phosphorus, an overestimation of 1 ug/L. Sampling on “nice” days, or days where there has been no rainfall in the past 3 days, results in an average of 22 ug/L, an underestimation of 3 ug/L. Sampling after a rainstorm (defined as 1 or more inches of rain within 2 days) results in an average of 33 ug/L, or an overestimation of 8 ug/L. Sampling at regular 3-week intervals resulted in the closest estimation of the seasonal average total phosphorus concentration.
We can’t eliminate all sampling bias. For one, LMVP volunteers sample during the day, mainly so they can see the Secchi disk. Additionally, the sampling schedule is set up so that the volunteers have some flexibility. It’s unreasonable to expect all volunteers to be out on the lake at precisely the same time every three weeks. As such, there will be a tendency for volunteers to choose the nicer days within their sampling window.
Safety is the most important consideration in choosing when to sample. If the weather is bad, volunteers should stay off of the water. Likewise, if debris in the water makes boating dangerous, sample collection can wait.
Sampling according to the schedule means that sometimes the lake will be muddy, but by sticking to the sampling schedule you help the LMVP describe Missouri water quality in the best way possible.
Total Phosphorus concentrations in Rocky Fork Lake measured daily during summer (grey line).
Top Graph, Circles represent Total Phosphorus values as measured once every 3 weeks
Middle Graph: Circles represent Total Phosphorus as measured following a period of at least 3 days with no rainfall.
Bottom Graph: Circles represent Total Phosphorus as measured the day after a rainfall of at least 1 inch.


