
Niangua Watershed Sampling Event
May 7, 2011

The Little Niangua River
The 125-mile long Niangua River meanders northward from the town of Marshfield on I-44 to the Lake of the Ozarks. Its watershed covers more than 658,000 acres and includes the Little Niangua River, Macks Creek, and the interestingly named Greasy Creek. Several springs feed the Niangua River, including the popular trout-fishing destination, Bennett Spring.
On May 7, 2011, 18 groups of volunteers collected 85 water samples at 78 sites across the Niangua River watershed. Our plan was to measure the water quality of this important Lake of the Ozarks tributary using volunteers and the existing University of Missouri/laboratory framework. Because of the large area and number of samples, we chose the "snapshot" method of gathering as many data points as possible in a single day.
Preparation
Once we decided on a sample date and a couple of locations for training, we prepared a web page and sent a press release to media outlets via the University of Missouri Cooperative Media Group. Existing mailing lists were used to reach individuals already active in water quality monitoring. The response from the Stream Team mailing list was great. Traditional media outlets (radio, television, print) paled by comparison.
To prepare for the training sessions, LMVP staff printed a 36" by 22" topographic map of the watershed, put identification labels on sampling containers and created the paperwork required to record all the necessary information. We had two training sessions for volunteers, one in Camdenton at the Missouri Department of Conservation office and the other at the lodge at Bennett Spring State Park. Because all we required was a bottle of water, training was a rather simple process. Our biggest concern was that samplers might hit the bottom with their sample bottle or accidentally sample the sediment "cloud" they kicked up when walking in the water. This was easily addressed by having volunteers wade into the stream and wait for the sediment cloud to wash away, then reach upstream to gather the sample. If the water was shallow at the sampling site, we provided the volunteer with an additional smaller bottle that could be submerged in the water without disturbing the bottom. Most of the training time was spent picking out sampling sites on our map. After training, volunteers went home with a sampling bottle and data sheet for each site they planned to visit.
Sampling Day, 5/7/2011
A few volunteers floated the rivers, collecting samples along the way. Often the floaters would paddle up tributaries they encountered and collect additional samples. Other volunteers sampled at road crossings, access points, or from private property. Each group sampled from 1 to 12 sites, for an average of almost five sites per group. Volunteers brought their samples back to the same location used for training, where MU staff were waiting to filter and store the water for later laboratory analyses.

Howard Webb photographs the shoreline conditions between his sampling locations
The Nutrients
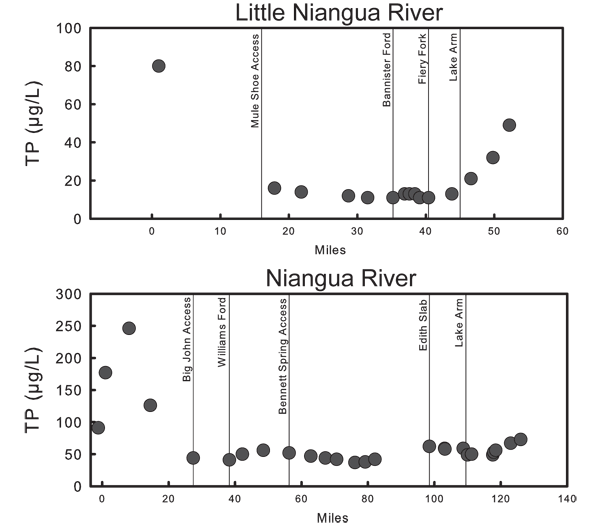
Total phosphorus (TP) and total nitrogen (TN) are the two nutrients primarily responsible for algae growth. Measuring these nutrients provides an estimate of the potential for algal growth. In lakes, the concentrations of these nutrients are typically highest at the end with the inflowing stream and decrease toward the lower end of the lake. On May 7, we found a different result.
In the Little Niangua River concentrations of both nutrients were highest at the uppermost site (near Tunas). By the next site, 18 miles downstream, concentrations dropped significantly and remained fairly constant until the lake arm, where both nutrients increased considerably (more than 4-fold for phosphorus and 6-fold for nitrogen). Niangua River nutrient concentrations were also highest in the upper reaches and had approximately double the nutrients found in the upper Little Niangua. Unlike the Little Niangua, nutrients did not increase dramatically in the lake arm. Tributaries tended to have somewhat less phosphorus but similar amounts of nitrogen compared to the Niangua and Little Niangua Rivers.

High water at the Moon Valley access one month prior to sampling date
The high nutrient levels at the upper sites of both the Niangua and Little Niangua probably reflect surface runoff following the rain that fell on the morning of the sampling day. The increased phosphorus in the lake arm of the Little Niangua is likely either backflow from the Niangua River or runoff from heavy rainfall event in mid-April.
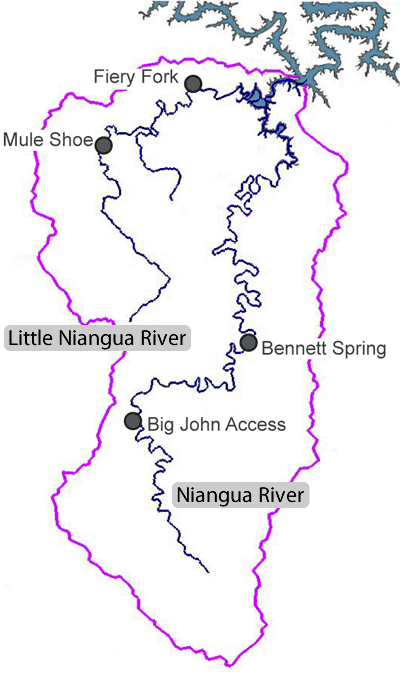
Locations used as reference points in the following graphs
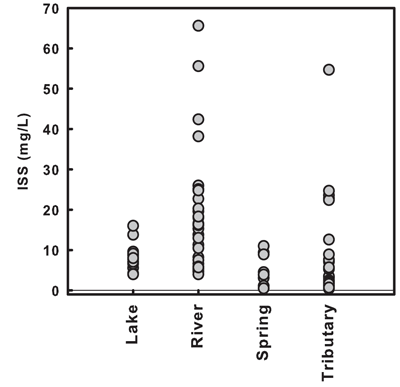
Suspended Sediment
As water scours the landscape following a storm, it picks up soil particles and carries them downhill to the stream or lake below. Once in the water body, the soil particles remain suspended in the water until the force of gravity's downward pull exceeds the force of the water's flow and the particles settle to the bottom. The movement of soil from higher elevation to lower elevation is natural, but it happens much faster when the land has been disturbed.
In general, we found more suspended sediment (inorganic suspended sediment, or ISS) in the river and tributary sites than in the spring and lake sites. The Little Niangua had considerably lower concentrations throughout than did the Niangua River. Both rivers had their highest concentrations at the uppermost reaches.
Salinity
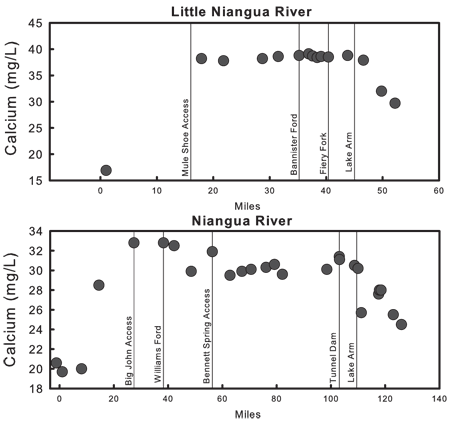
Water is a great solvent. The water in rivers and lakes dissolves various minerals as it flows over rocks and through soil. Many dissolved minerals are found in our waters, but eight tend to be more abundant: calcium, magnesium, sodium, potassium, bicarbonate, carbonate, sulfate, and chloride. When dissolved in water, these minerals contribute to its salinity.
The concentrations of the various dissolved minerals are dependent on a number of factors, but primarily the type of rock and soil found in the watershed. For example, limestone contains around 51 parts per million (ppm) calcium, while granite contains less than 1 ppm. A stream flowing across limestone will have significantly higher calcium concentrations than a stream flowing across granite. Another important factor is the amount of time spent in contact with rock and soil. During a rain event some water infiltrates the soil while the rest moves across the surface as runoff. The water that infiltrates will move slowly through the soil and may, over time, enter the stream as groundwater flow. This water contains substantially more dissolved minerals than the surface runoff due to the extended time in contact with rock and soil.

Eroded streambank along an abandoned road in the Niangua watershed.
Because this snapshot sampling took place within a single watershed with similar geology throughout, we would expect the dissolved mineral content to be similar in samples collected throughout the watershed. Any sites with out-of-the-ordinary dissolved mineral concentrations could be influenced by a pollution source. One specific indicator of human influences is elevated levels of sodium and chloride. These minerals are found in high concentrations in waste water effluent due to the high salt content of human diets and the high sodium levels found in laundry detergent.
The mineral content of samples from the Niangua watershed were dominated by carbonate/bicarbonate, calcium, and magnesium. The highest values were found at spring sites, which is expected given the nature of springs. Along with higher concentrations, these minerals also showed the most variability among samples. In contrast, potassium and sulfate showed low values and little variability across the watershed. Chloride and sodium values also tended to be fairly low and stable across the sample sites, with the exception of one tributary site that receives effluent from a sewage treatment plant. This site had chloride and sodium concentrations that were three times higher (or more) than those found in the other tributaries.
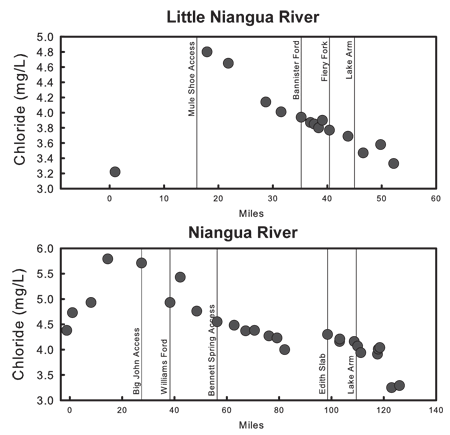
The patterns of dissolved minerals were comparable in both the Little Niangua and Niangua rivers. Calcium, magnesium, and carbonate/bicarbonate levels were low at the upper-most sites due to runoff associated with the rain that fell the morning of the sampling event. Concentrations through the majority of the rivers were higher and stable, indicating the water was probably dominated by groundwater flow. Sample sites in the lake showed slight decreases in the calcium, magnesium and carbonate/bicarbonate levels, probably due to the large amount of surface runoff that had occurred in the watershed during the two weeks prior to sampling.
Chloride concentrations differed from calcium and magnesium in that there was a steady decrease in concentrations across the rivers instead of stable levels. This may indicate that this mineral was being taken up and used by aquatic plants and animals. Sodium and potassium values were low and showed no true pattern across the rivers.
Summary
Magnesium, calcium, and alkalinity (carbonates and bicarbonates) data provided a way to estimate the relative influence of surface runoff and ground water flow at individual sites. This information, when combined with nutrient data, help us to distinguish between nonpoint and point sources of nutrients.
Elevated nutrient levels in the upper reaches of both the Niangua and Little Niangua rivers (as well as in a few of the tributaries) suggest that nutrient inputs occur throughout the watershed, and any future efforts to reduce nutrient levels at the Lake of the Ozarks will need to involve the entire watershed.
Note that the results of this sampling effort do not reflect average conditions at these sites, but rather show how water quality varied across this watershed on a single day.